How to Measure the Impact of Sales Training
Sales performance improvement

Written by: Erin Smith, Chief Revenue Officer
Published: October 16, 2026
ATD's 2023 State of Sales Training research found that the median organization spent between $1,000 and $1,499 per salesperson on sales training in 2022.
Earning a return on this investment requires measurement that covers every part of a sales training initiative, not just course completion.
Key Takeaways
- Measure sales training across three layers, which we call the E3 of learning metrics: Engagement, Experience, and Effect.
- Effective measurement guides the training process as it unfolds, and it helps learners as much as leaders.
- Business impact is only credible when leaders have a high degree of confidence in the other layers of data.
Why Does Measuring Sales Training Matter?
Analytics do more than verify outcomes at the end of training. They steer the training process as it unfolds. Sellers discover where they need to focus their attention and where their blind spots reside. Measurement is for the learner as much as it is for the leadership.
Why Is Sales Training Hard to Measure?
Many selling organizations fail to generate and measure data. The data sits in separate systems. This separation makes it difficult to connect the data to business impact. The available data also represents different levels of accuracy, which forces leaders to qualify the analytics first. Even after meeting these challenges, it is difficult to know what to measure.
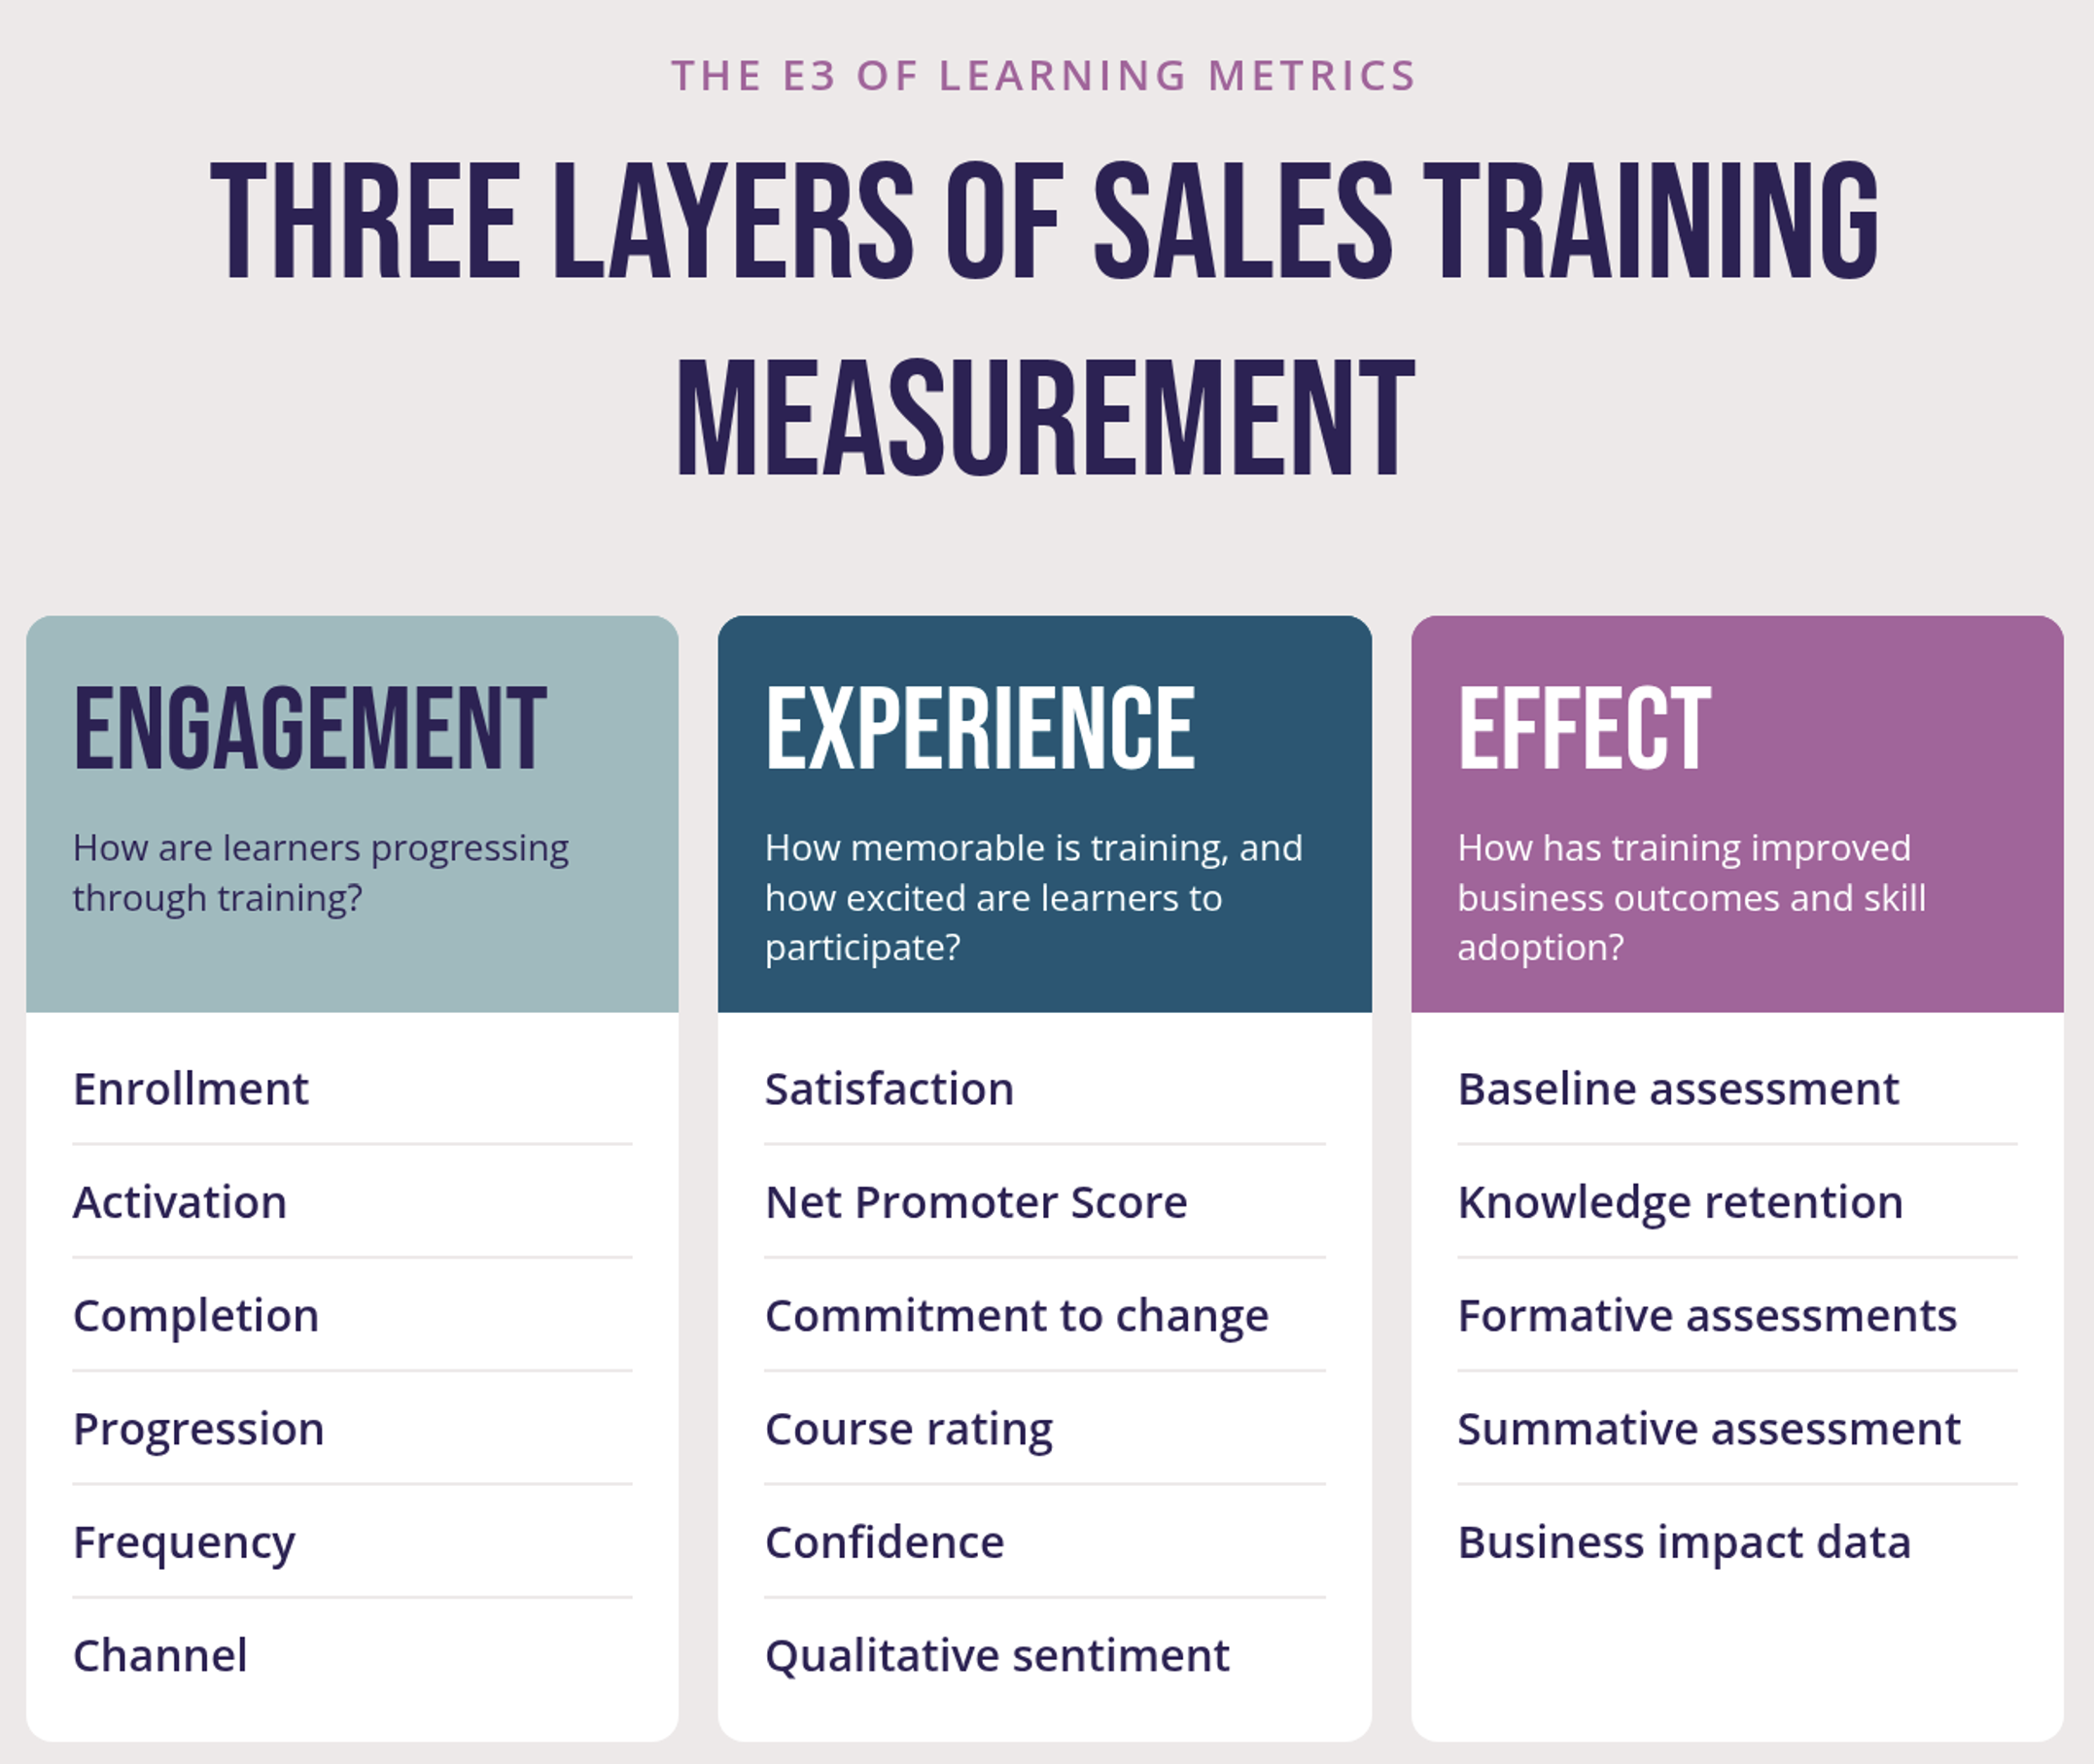
A simple framework helps. We segment measurement into three sections, the E3 of learning metrics:
| Layer | The question it answers |
|---|---|
| Engagement | How are learners progressing through training? |
| Experience | How memorable is training, and how excited are learners to participate? |
| Effect | How has training improved business outcomes and skill adoption? |
How Do You Measure Engagement?
Engagement matters because learning no longer ends when a course does. The harder question is how to measure it accurately.
A company can get an overview of engagement by looking at the percentage of the addressable population that is enrolled in training. Leaders can build on this by examining activation, expressed as a percentage of enrollment. Activation shows how many participants are using the training platform. The two data points work together because high enrollment offers no value without a strong activation rate. Organizations can go further by looking at completion to determine how far trainees have moved through training.
Enrollment, activation, and completion are all valuable. Leaders today also examine more granular metrics:
Progression
Progression measurement goes beyond tracking whether a participant has completed a course. It tracks the percentage of completion toward a milestone and the pace of completion. This detail matters as participants engage in training that extends over several months. Progression shows whether the learner is on track and moving at the right pace. Leaders can course-correct in real time.
Frequency
Frequency indicates a participant's general level of activity by showing average session time, when they last logged in, and the number of days between activities.
Channel
Channel metrics show how many learners are logged on via desktop versus mobile. This matters because leaders of highly distributed field sales organizations want more mobile engagement from sellers who travel. Leaders of inside sales organizations look for more desktop usage.
How Do You Measure Learner Experience?
A good learner experience matters because it drives adoption of skills and, ultimately, better outcomes. Experience measurements should not be "one and done." Leaders need to know a learner's satisfaction with training not only today, but over the following months. That change over time matters most in long programs.
Experience measurements include:
- Satisfaction
- Net Promoter Score
- Commitment to change
- Course rating
- Confidence
- Qualitative sentiment
Each gives managers a timely read on whether skills will hold up in real selling situations.
Confidence is a good predictor of how likely a seller is to use a skill in front of a customer, so ongoing confidence ratings throughout training are worth building in. Qualitative sentiment adds free-response feedback from sellers in the field, which lets managers interpret the numbers. If an organization sees its Net Promoter Score falling, it can turn to qualitative sentiment for the detail on why.
How Do You Measure the Effect of Sales Training?
There are several ways to measure effect. The traditional Kirkpatrick training evaluation model is strong. The Kirkpatrick model evaluates training effectiveness across four levels: reaction, learning, behavior, and results. We often think of effect as business impact. The Kirkpatrick model reminds us that we only reach business impact when we have a high degree of confidence in the other three levels of data.
An effective approach combines these measurements:
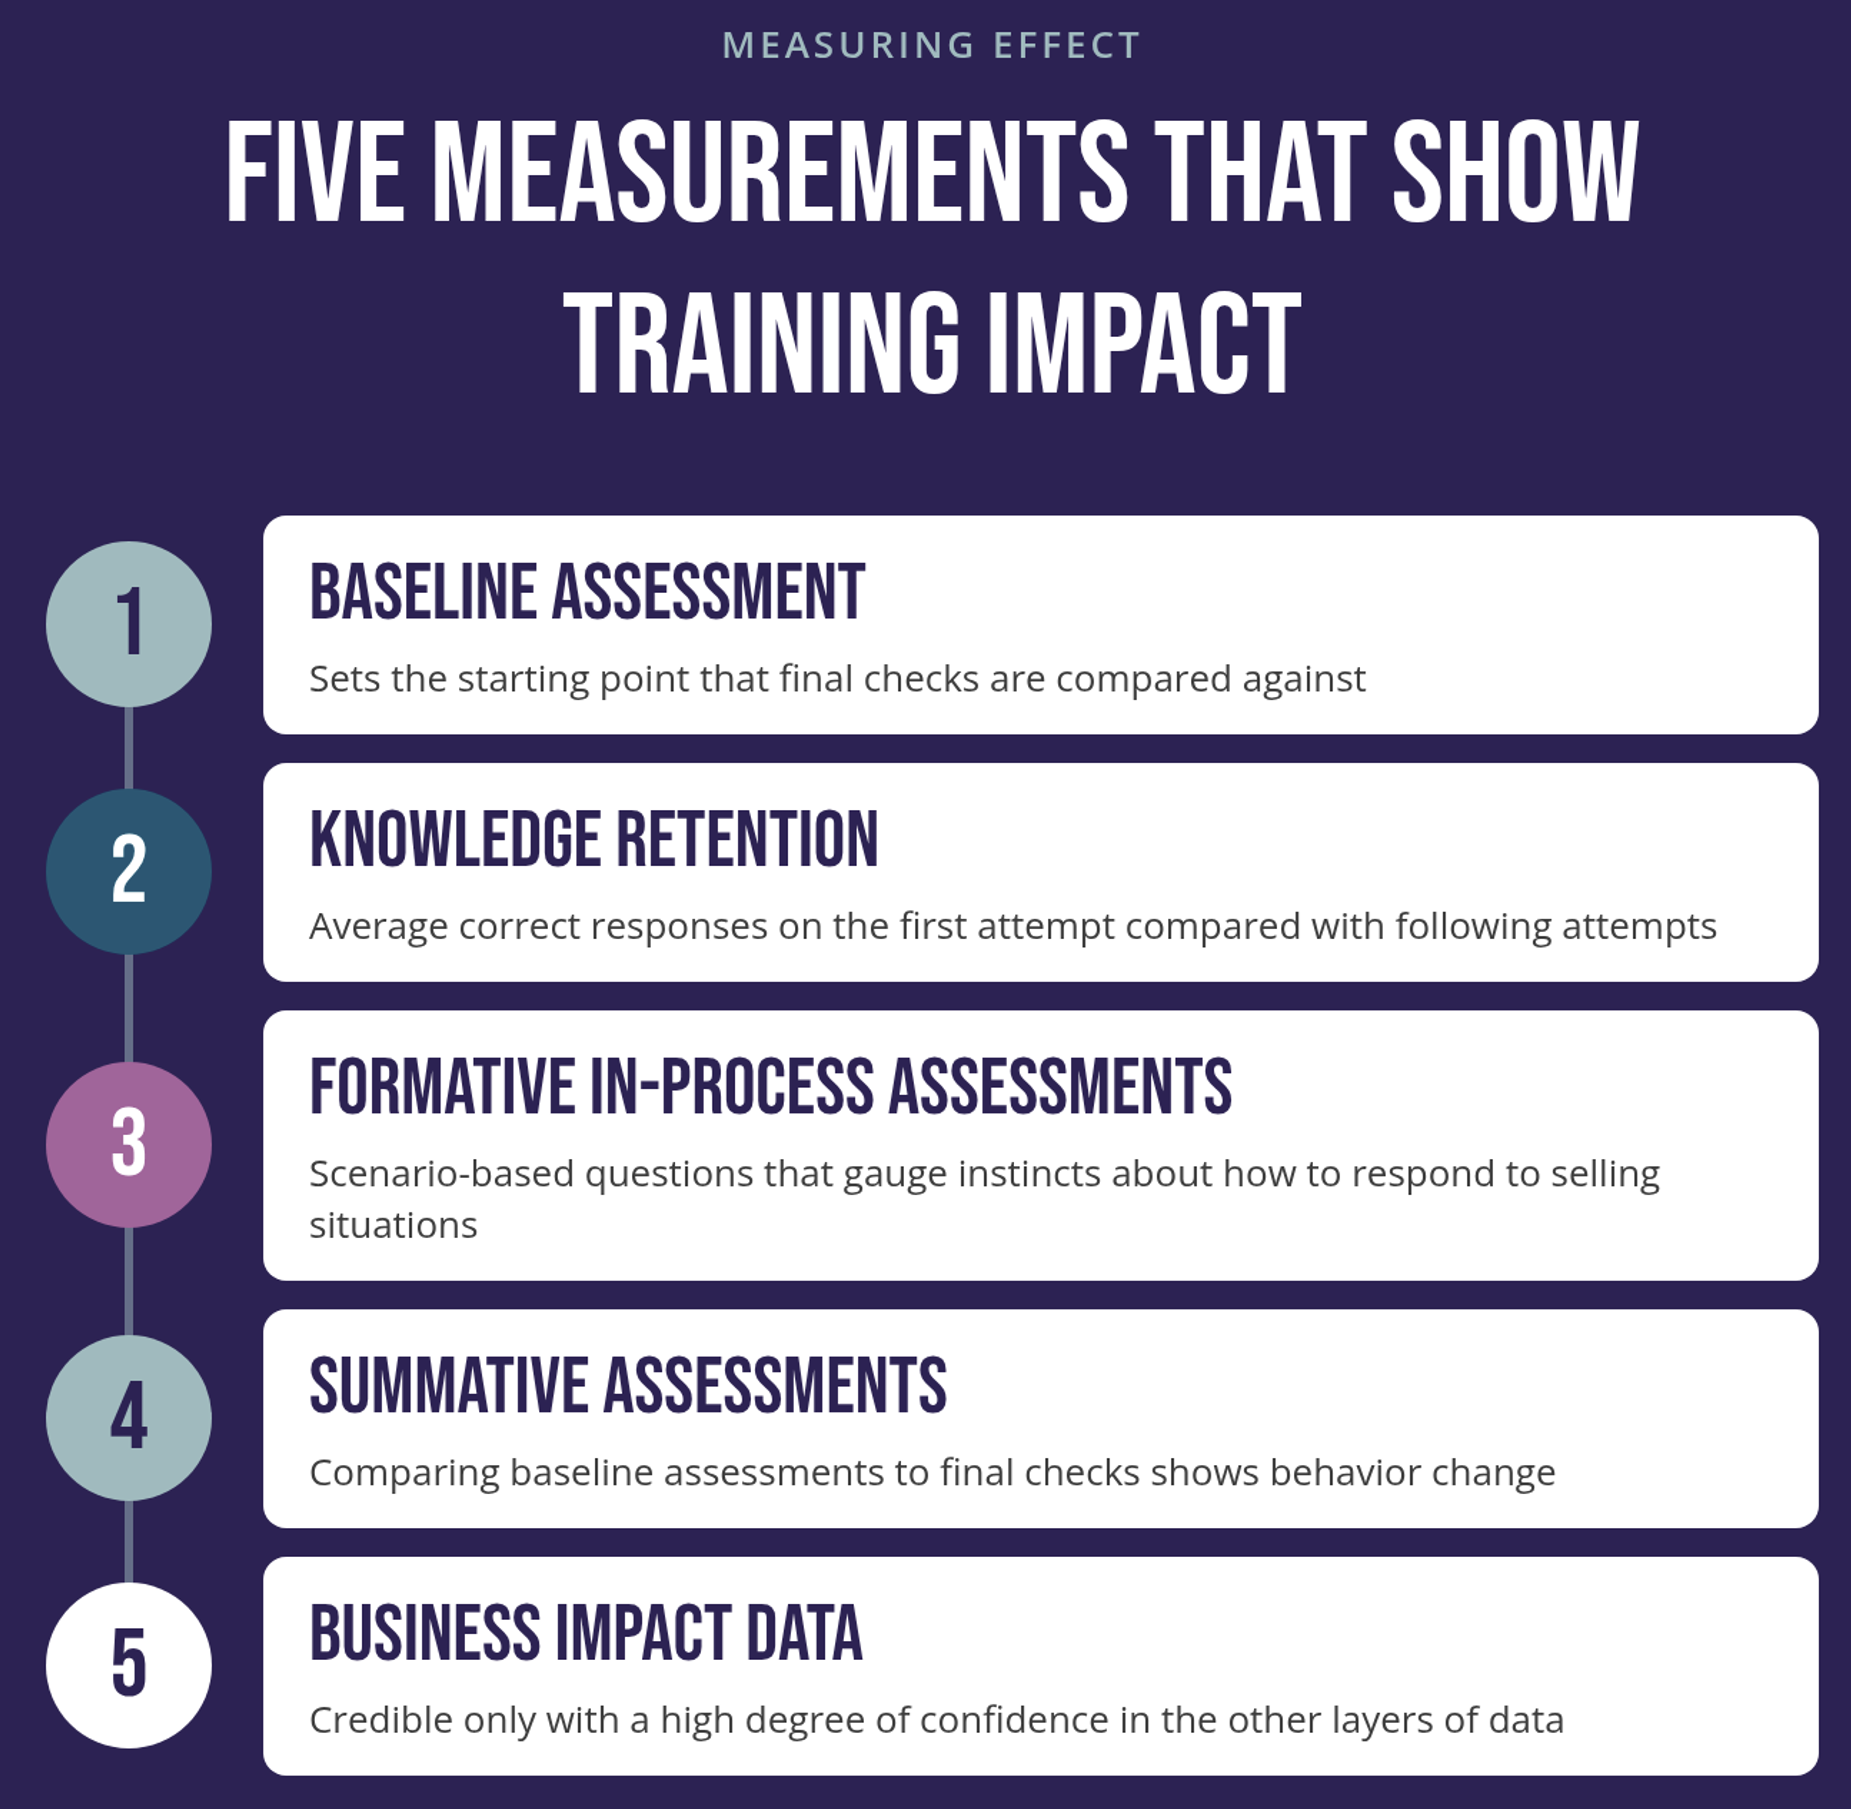
- Baseline assessment
- Knowledge retention
- Formative in-process assessments
- Summative assessments
- Business impact data
Knowledge retention can be measured by comparing the average number of correct responses to a question on the first attempt with the average number of correct answers on following attempts. Behavior change shows up when you compare learners' baseline assessments to their final checks. Questions like these go beyond traditional multiple choice. Learners see scenario-based questions that gauge their instincts about how to respond to selling situations.
"They have worked closely with us over the past 3 years to go above excellent training and actually deliver measurable and defined commercial results that supports meeting our sales goals." — Nick Hine, Global Commercial Learning Director, Veolia Watertech
How Do You Bring Engagement, Experience, and Effect Together?
The challenge with using data to expose learning impact is that the metrics often live in different sources. Querying each system, then lining up the data over time, demands too much time.
We recommend visualizing the data. A single view lets leaders query and combine the information, then act on it. A good measurement view answers three questions:
- What is the level of engagement among learners?
- What experiences are learners having?
- What impact and effectiveness is learning providing?
Richardson Sales Performance built Accelerate Prism around this idea. It follows the logic of the Kirkpatrick model, measures capability repeatedly rather than only right after training, and connects capability development to observable seller behavior and the sales outcomes your business already measures.
Richardson Sales Performance uses these three measurement categories — engagement, experience, and effect — so learners and managers can track and refine training.